Discovery workshop · Geography · 6e → 5e · ages 11 to 13
Reading a climate chart: hot, cold, dry or wet?
Météo-France normals, from Brest to Cayenne: read each month’s temperature and rainfall, spot the dry months and recognise a climate from its chart.
- ⏱ 15 to 20 min
- 8 missions
- 3 levels: discover, understand, go further
The short answer
How do you read a climate chart?
Each month has a bar and a dot, worked out as averages over thirty years. The bar gives the month’s rainfall, in millimetres, on the right-hand scale; the dots, joined into a curve, give the temperature, in degrees, on the left-hand scale. By convention, a month is called dry when its rainfall in millimetres is less than twice its temperature: P < 2T.
With the Family plan
- They understand what they see in class. Every maths and science idea becomes an experiment they get their hands on.
- They get going on their own. 15 to 20 min: a hint when they get it wrong, the solution only after three tries.
- You see what they did. Mission by mission, in your parent space.
No bank card. Afterwards: €6.90 a month, no commitment · or €49 a year
Cancel online at any time, effective at the end of the paid month. Terms of sale
- Your account
- Your e-mail confirmed
- The course, straight away
The plan opens every course: 244 workshops, 114 modules and 49 labs, from age 9 to university level.
See the plans →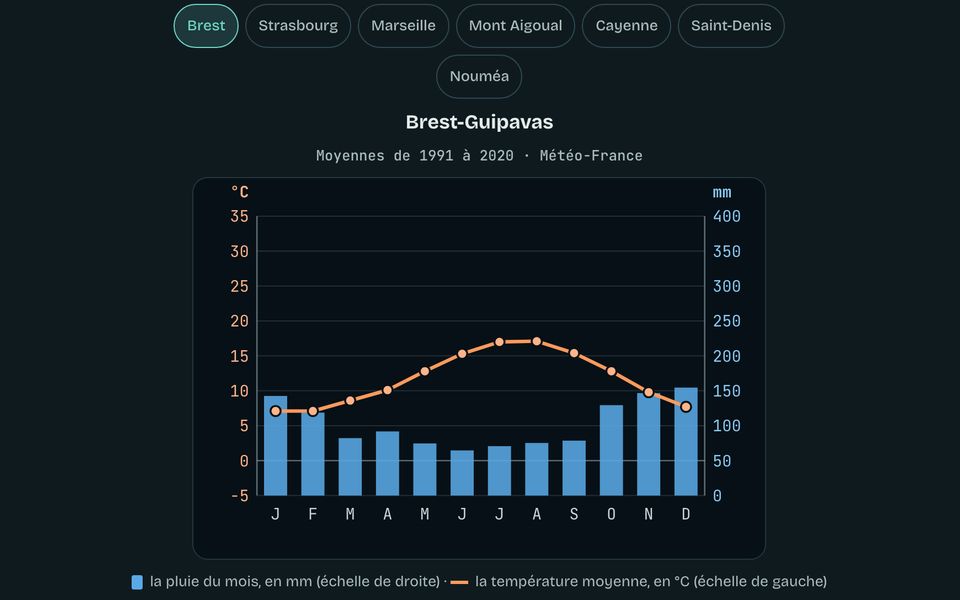
What they will do
- 1DiscoverBars for the rain, a curve for the temperature
- 2UnderstandThe temperature range and the dry months
- 3Go furtherRecognising a station from its climate chart
8 missions to complete, level by level.
Already have an account? Sign in
Teacher? A free 2-month trial for your class. Write to us
- Card payment, on Stripe’s secure page
- No ads, no data sold
- Data stored in France